Reproducibility of human atrial muscle models of diabetic and non-diabetic cardiac mechanoenergetics
Abstract
To explore the effects of diabetes on cardiac function, Musgrave et al. (2025) developed a pair of non-diabetic and diabetic cross-bridge models. These were parameterised using novel human experimental data, and coupled to thin filament calcium activation and passive force muscle models to enable simulation of muscle mechanoenergetics under work-loop contractions. The present study explores and assesses the reproducibility of the simulations performed with these published models. The authors provide original MATLAB code which reproduces all the figures presented in the Primary Publication. To facilitate broader reuse, they additionally provide CellML code for performing the muscle mechanoenergetics simulations using OpenCOR and Python with a Jupyter Notebook. There were slight discrepancies that could not be adjusted for in the OpenCOR simulations, which were likely due to different solvers used in the two platforms. However, these differences did not markedly affect the output metrics of the model simulations performed in OpenCOR, which are materially equivalent to the original simulation results.
1Introduction
While the cardiac function of individuals with type 2 diabetes is ostensibly impacted at the whole-heart level, the development of heart disease in diabetes originates at the cellular level. Biophysically-based models of cardiac cellular function are a powerful tool for both investigating mechanisms of disease development as well as for predicting outcomes that can not easily be experimentally measured. Using experimental data from permeabilised atrial tissues from non-diabetic and diabetic human patients Musgrave et al., 2025, the Primary Publication Musgrave et al., 2025 developed cross-bridge and muscle models to investigate the effect of diabetes on cardiac function. In addition to offering mechanistic insights into the interactions between diabetes and cardiac mechanoenergetics, these models are the first human atrial models of this type and are suitable for integration into higher-level models. As such, this study aims to demonstrate their reproducibility and outline the different ways in which the model simulations can be performed.
2Model description
The Primary Publication Musgrave et al., 2025 presents a novel model of human atrial cross-bridge mechanics to identify differences in cardiac mechanoenergetic function between patients with and without diabetes. This is a mean-field cross-bridge model described by Ordinary Differential Equations (ODEs) in a general form first introduced by Razumova et al. (1999). The Musgrave et al. (2025) cross-bridge model was derived from a previous rat cross-bridge model formulated to be sensitive to changes in ATP and inorganic phosphate (Pi) Musgrave et al., 2024. This model was modified and parameterised to human experimental data from Musgrave et al. (2025), which included complex modulus measurements across a range of metabolite conditions, in both non-diabetic and diabetic patients.
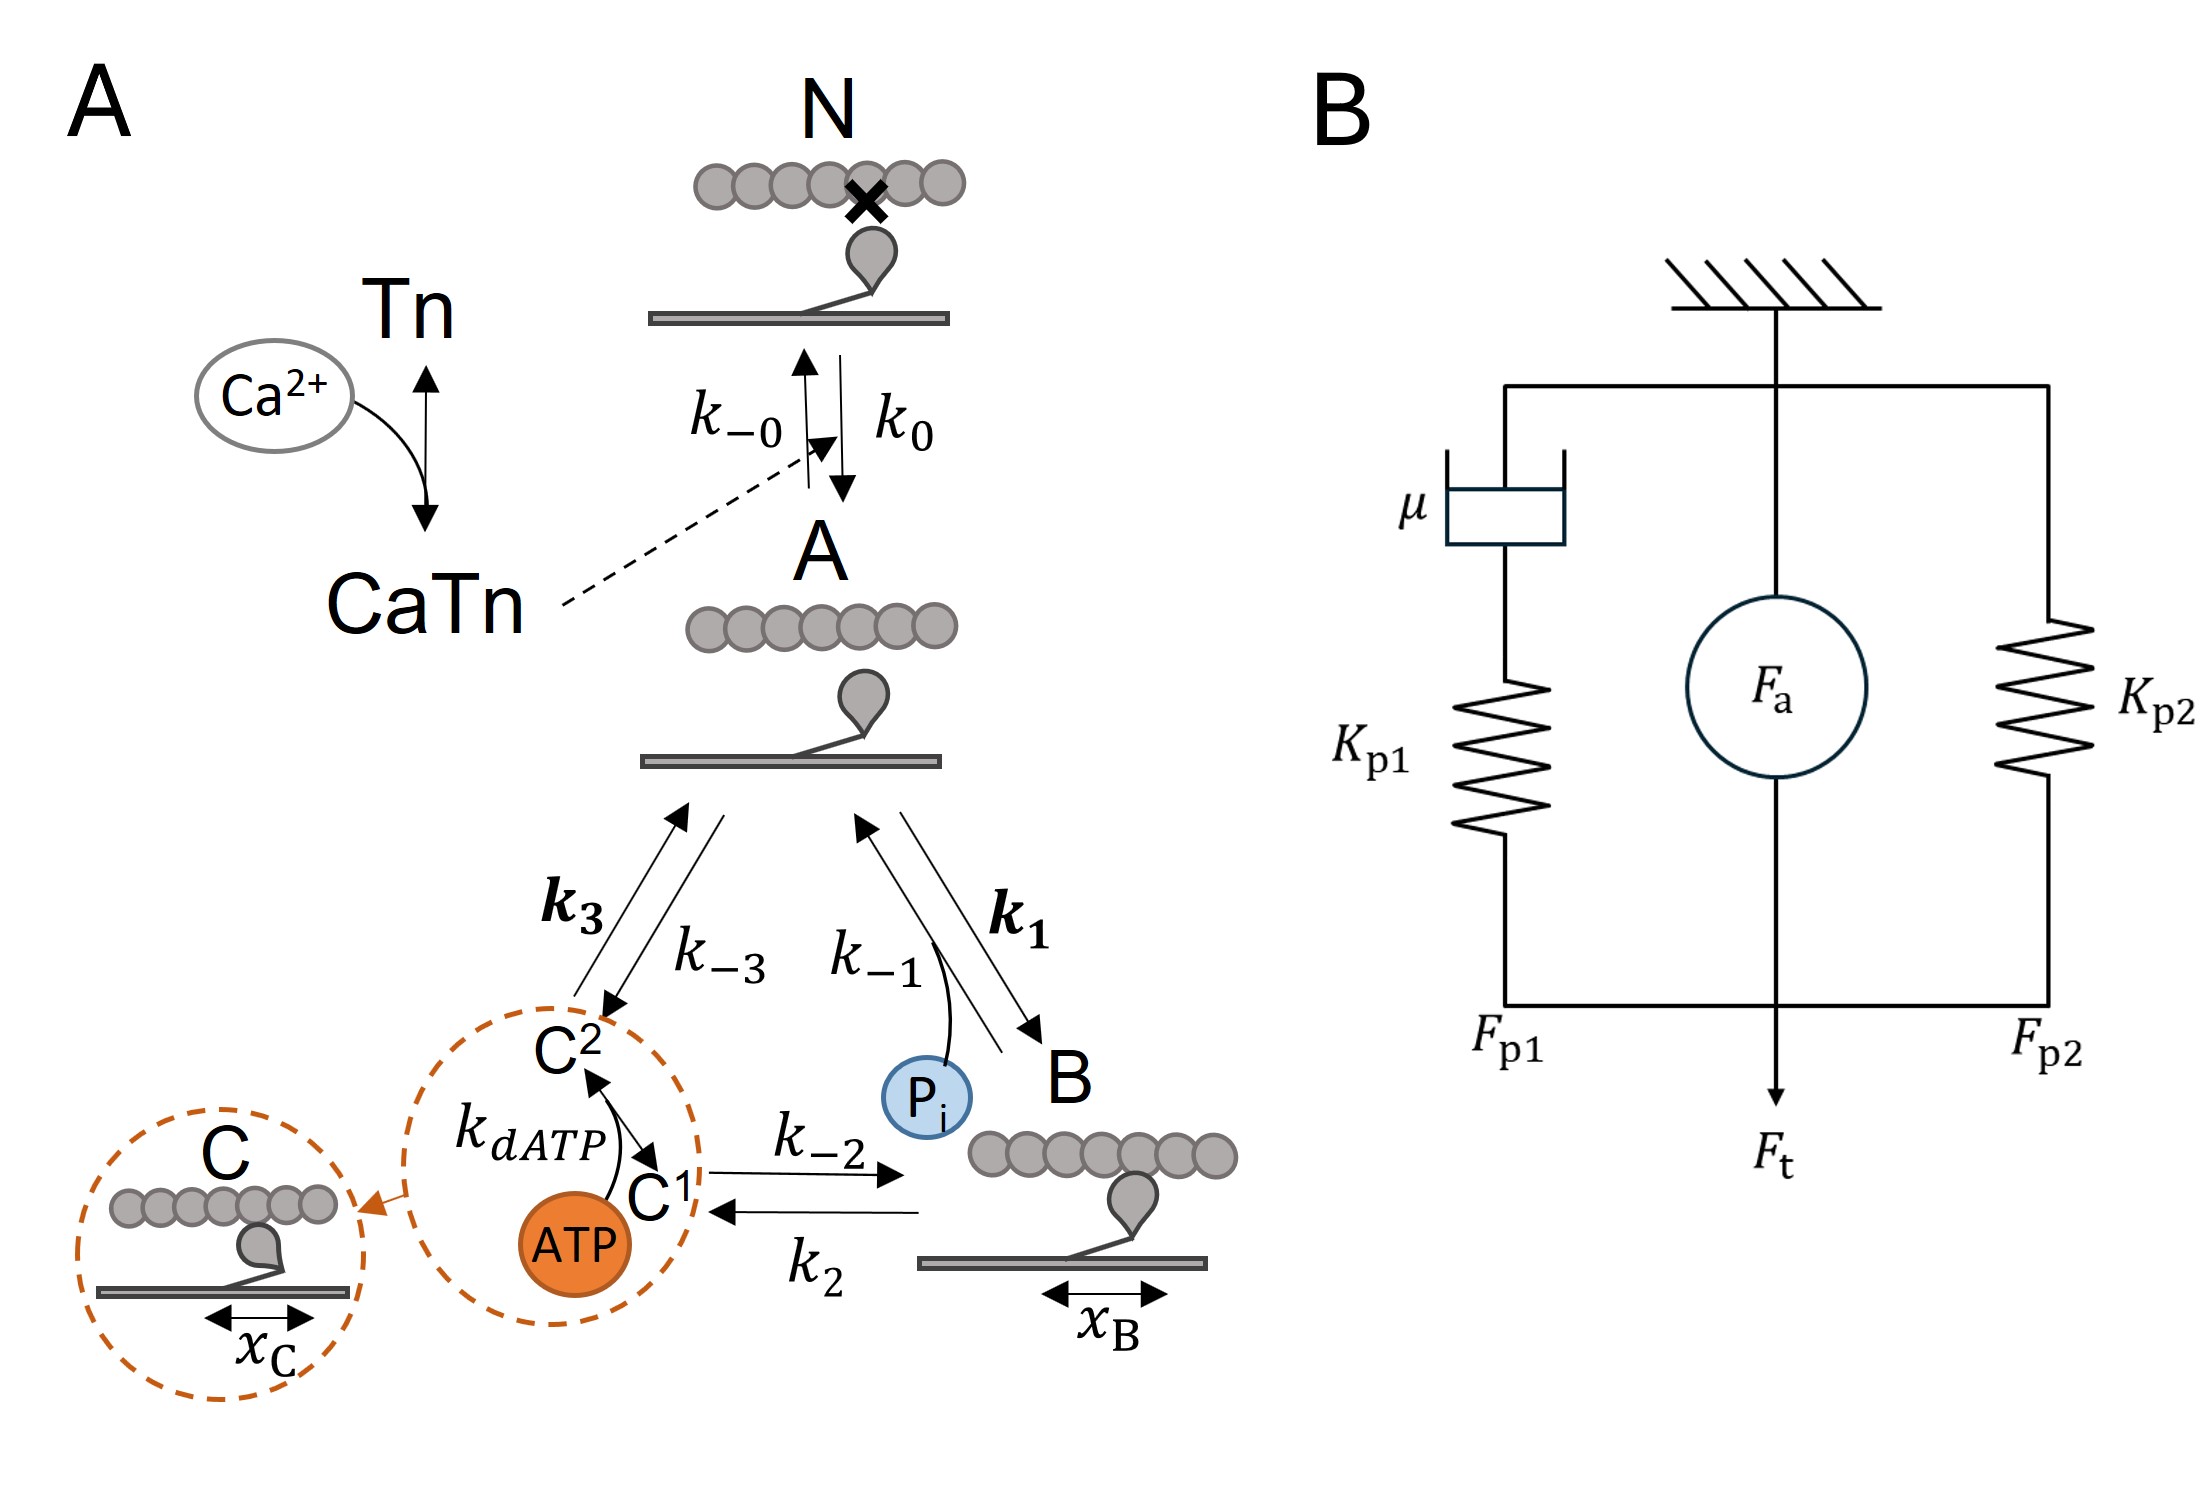
Figure 1:A: the cross-bridge model has three main states (states A, B and C) and is sensitive to Pi and ATP. State C consists of substates C1 and C2. The bolded transition rates () are dependent on cross-bridge strain. State N is a non-permissive state where cross-bridges cannot form. Thin filament regulation by Ca2+ allows cross-bridges to transition from state N to state A. B: model of total muscle force consisting of a spring () and damper () in series, which is in parallel with a non-linear spring () and an active force element () that is the cross-bridge model. Reproduced from Musgrave et al. (2025) under CC BY 4.0.
In Musgrave et al. (2025), the core cross-bridge model was extended to produce a muscle model capable of simulating typical experiments performed with one-dimensional tissue preparations, specifically, isometric and work-loop contractions. The simulations of the complete muscle model are the focus of this reproducibility study. A model of thin filament calcium regulation in human cardiac cells was taken from Land et al. (2017) and integrated into the cross-bridge model (Figure 1A). This model was driven by non-diabetic and diabetic human atrial Ca2+ transients measured by Jones et al. (2023), enabling simulation of transient activation at 1 Hz twitching frequency. Passive muscle properties reported in Musgrave et al. (2025) were fitted to the passive elements of a cardiac muscle model from Tewari et al. (2016). The muscle schematic including active (cross-bridge) and passive elements is described by Figure 1B.
3Model Modifications
MATLAB was used for the simulations described and presented in the Primary Publication, but the authors have added a suite of CellML code and an accompanying Python Jupyter Notebook to the model repository to facilitate reusability. This addition does not aim to reproduce all of the figures in the Primary Publication, but instead focuses on implementation of the two types of simulations performed with the muscle model: isometric contractions and work-loop contractions. These are simulated using the non-diabetic and diabetic muscle models under baseline metabolite conditions (5 mM ATP and 1 mM Pi). The Jupyter Notebook additionally provides suggestions for modifying the code to perform simulations at the myocyte level and under different metabolite conditions.
Work-loop simulations require the function describing the sarcomere length derivative to change depending on the current phase of the loop. CellML cannot support such behaviour directly, so the Python integration was required to implement a functional algorithm to simulate it. First, the isometric (default), isotonic and re-stretch phases of length control described in Musgrave et al. (2025) were each encoded into separate CellML files. These were called successively using the Python opencor module and their outputs temporally stitched together to produce a complete work-loop. The different phases and their relevant code are described in Figure 2. The simulation begins with an isometric phase using the default CellML file. The time point where muscle stress reaches the afterload stress marks the end of the isometric phase and is used as the starting point for the isotonic phase. The muscle shortens during the isotonic phase to maintain the specified afterload stress. The time point when the muscle reaches a minimum sarcomere length during isotonic contraction marks the end of the isotonic phase and the start of the relaxation phase. Here, the simulation returns to isometric mode until a total of 800 ms has passed. At this point, the two re-stretch phases are implemented as in Musgrave et al. (2025). The first is a gradual increase lasting for 50 ms and the second is a constant shortening rate which re-stretches the muscle back to its initial length over 100 ms. Finally, the simulation returns to isometric mode for the last 50 ms of the cycle.
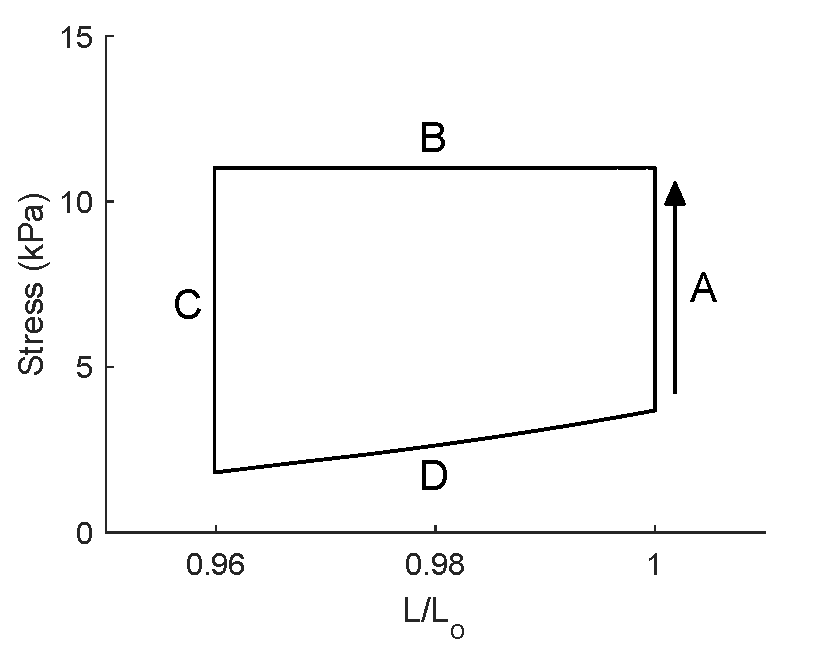
Figure 2:Example of a simulated work-loop demonstrating the different phases. A: isometric contraction, using the default CellML code ("musgrave_2025_nondiabetic.cellml"). B: Isotonic contraction, using the isotonic mode ("musgrave_2025_nondiabetic_isoton.cellml"). C: Isometric relaxation, using the default CellML code again. D: Re-stretching phase using the two re-stretching modes ("musgrave_2025_nondiabetic_RS1.cellml" and "musgrave_2025_nondiabetic_RS2.cellml").
4Computational Simulation
The model code can be downloaded from https://
4.1MATLAB Code
The MATLAB code contains two scripts for running the model simulations. The first, "paper_figure_plotting.m", reproduces all of the figures presented in the Primary Publication. As complete simulations are run for each figure, each may take a few minutes. The figures are organised into separate sections, allowing users to run them individually if they are interested in a specific one. The function describing the muscle model is "Mmodel_2025_Human.m", which takes different input parameters to simulate outputs for the non-diabetic and diabetic models. These are specified for the cross-bridge and passive elements of the model in a single array in separate data files (e.g. "ND_xb_fit.mat" specifies the cross-bridge parameters for the non-diabetic model). The muscle model simulations are driven by an array of time and Ca2+ transient data which are linearly interpolated to determine the intracellular Ca2+ value at each time step of the simulation. Simulations with this model are performed with MATLAB’s ode15s solver, specifying a relative tolerance of 1e-6. The second script "run_human_Ca_transient.m" takes the user through several different types of simulations that can be performed with the model. This includes an isometric contraction, a set of work-loop contractions and a length perturbation simulation where the cross-bridge model is maximally activated by Ca2+. For this reproducibility study, figures were produced by running the first script.
The "paper_figure_plotting.m" script was run in MATLAB 2021b on Windows 11.
4.2CellML code
Each of the non-diabetic and diabetic muscle models has a primary CellML file, (e.g. "musgrave_2025_nondiabetic.cellml") which can be run directly in OpenCOR to produce isometric contraction simulations. The simulations require a step size no larger than 0.001 s; SED-ML files are provided to encode these simulation parameters and produce a few typical output plots. In order to drive the CellML models with the same Ca2+ transients as the MATLAB models, these array data are encoded with piecewise functions for the Ca variable, to match the time points at which the data were collected. As the data were sampled at 1 kHz, this is a large file and is encoded in CellML separately for each of the non-diabetic and diabetic data (e.g. "nondiabetic_calcium.cellml). Separate calcium files are imported into the relevant main CellML files. These can be replaced with a different Ca2+ transient if desired by the user. The repository contains Python code for converting Ca2+ transient data to CellML Text code.
In order to also simulate work-loop contractions as described in the Primary Publication, several different CellML files must be called in a given simulation (Figure 2). This is facilitated via the Python opencor module, which is called in the Jupyter Notebook file "Human Cross-Bridge Modelling.ipynb". Instructions for setting up Jupyter with OpenCOR are included at the top of the Jupyter Notebook. Briefly, OpenCOR must be installed in a directory with write permissions. To connect to the Jupyter server, open a command window in a directory containing the Jupyter Notebook file and paste the path of the "jupyternotebook.bat" batch file located in the OpenCOR installation. Ensure that all the CellML and SED-ML files are also contained in this directory and open the Jupyter file from the root page opened in the browser after executing the batch file. Running all cells in this Jupyter Notebook produces side-by-side simulations of isometric contractions and work-loop contractions for the non-diabetic and diabetic models. The six output metrics of the work-loop contractions analysed in the Primary Publication are also calculated and plotted here.
The Jupyter Notebook "Human Cross-Bridge Modelling.ipynb" was run using OpenCOR 0.8.2, which comes bundled with Python 3.12.2, on Windows 11.
5Reproducibility goals
The objective of this study is to demonstrate reproducibility of Figures 5-11 of the Primary Publication using the MATLAB implementation. In addition, reproduce the results of key isometric and work-loop simulations - corresponding to Figures 5A, 6 and 7 - using the CellML implementation executed via the Jupyter Notebook.
6Reproducibility results
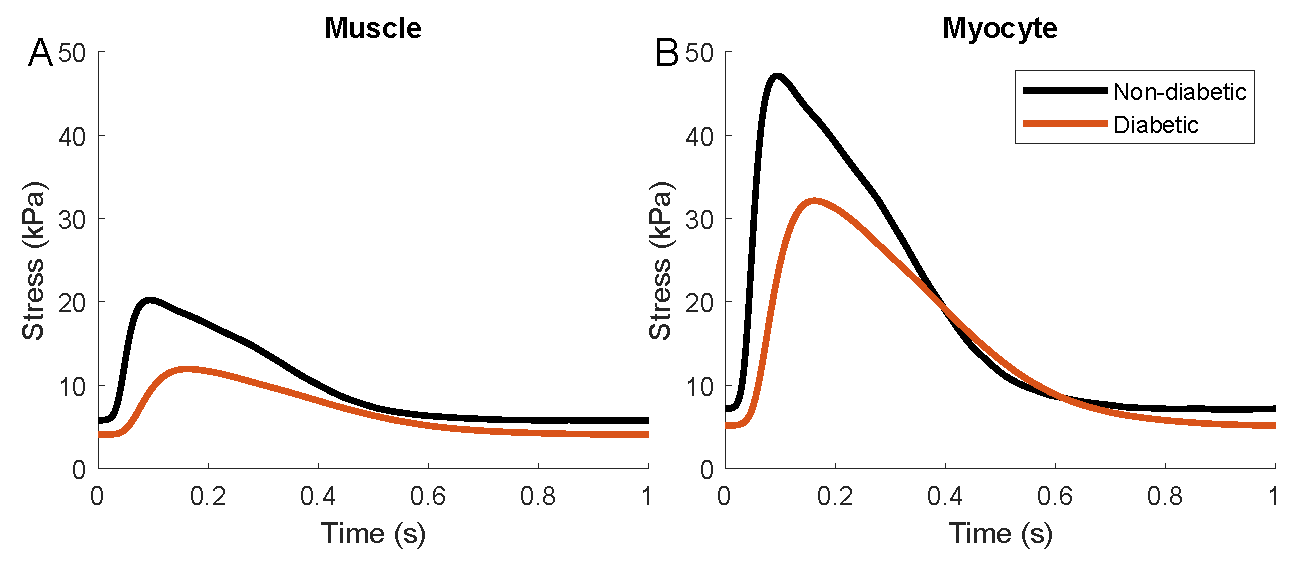
Figure 3:Reproduction of Figure 5 in Musgrave et al. (2025) using the MATLAB script. This demonstrates simulation of isometric contractions in both models, scaled to the muscle as well as a single myocyte.
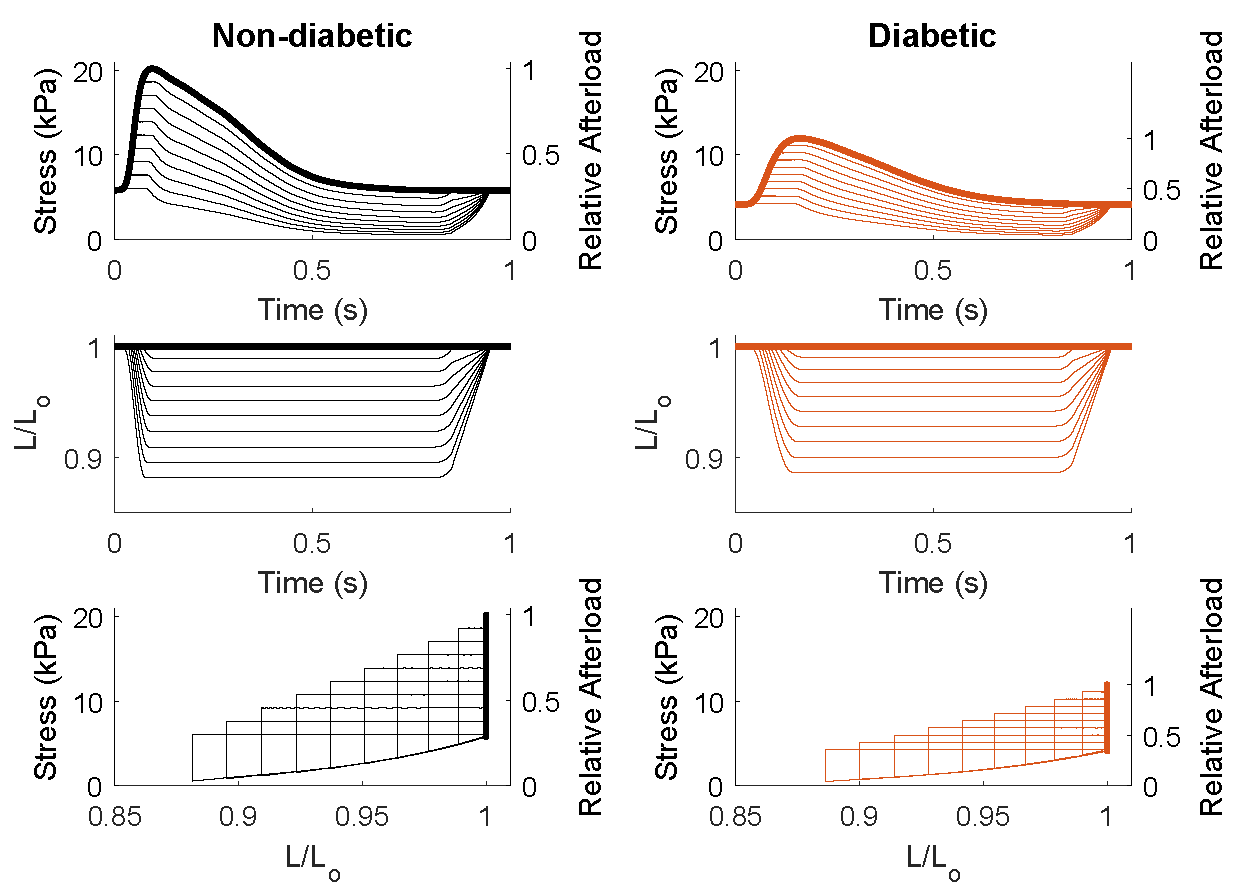
Figure 4:Reproduction of Figure 6 in Musgrave et al. (2025) using the MATLAB script. This demonstrates simulation of work-loop contractions in both models, which are performed across a range of suitable afterloads. The isometric (maximum afterload) curve is in bold.
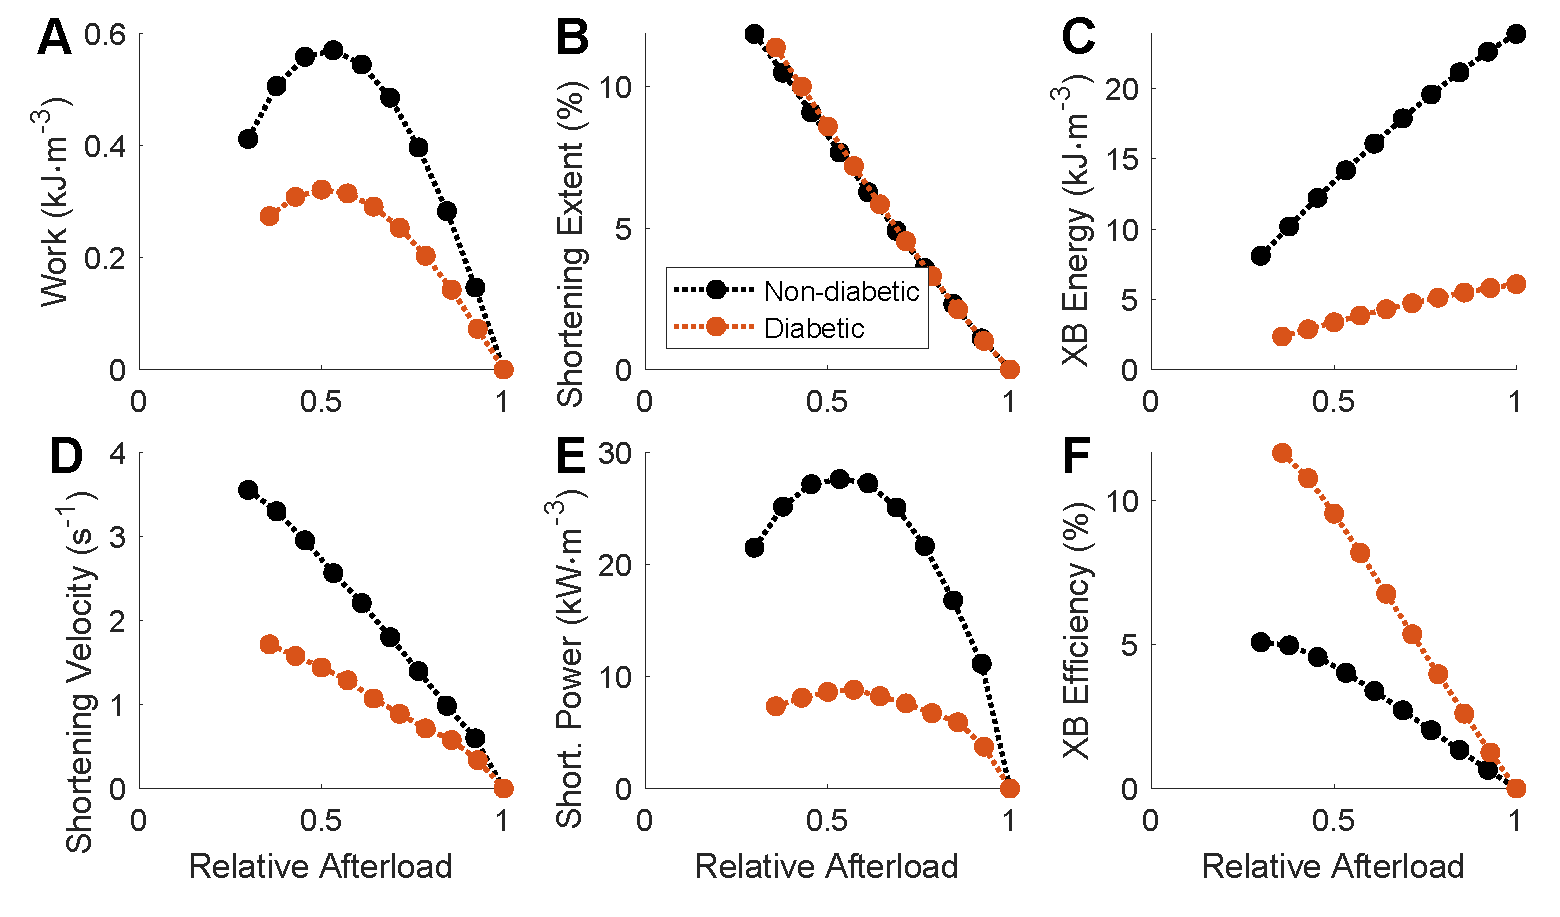
Figure 5:Reproduction of Figure 7 in Musgrave et al. (2025) using the MATLAB script. This demonstrates the output metrics calculated from the range of work-loop simulations performed in Figure 4.
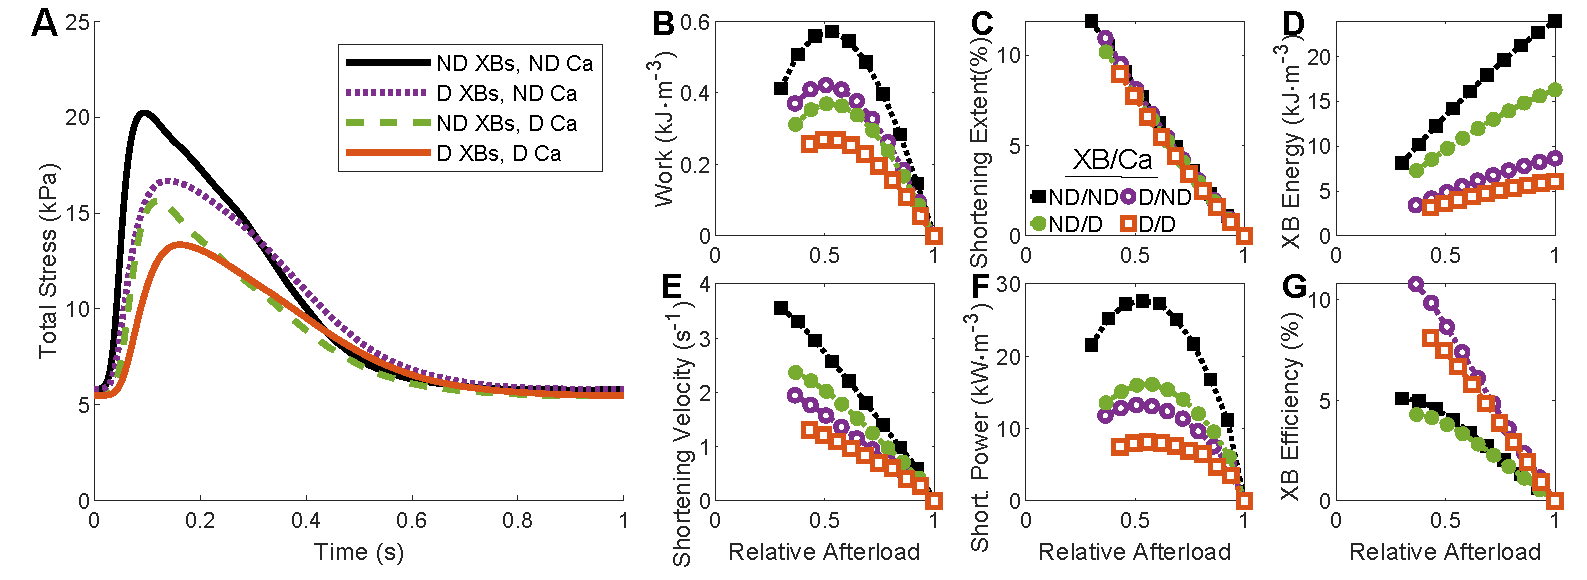
Figure 6:Reproduction of Figure 10 in Musgrave et al. (2025) using the MATLAB script. This demonstrates isometric and work-loop simulations under different combinations of the cross-bridge and calcium elements of the model, with the same passive model.
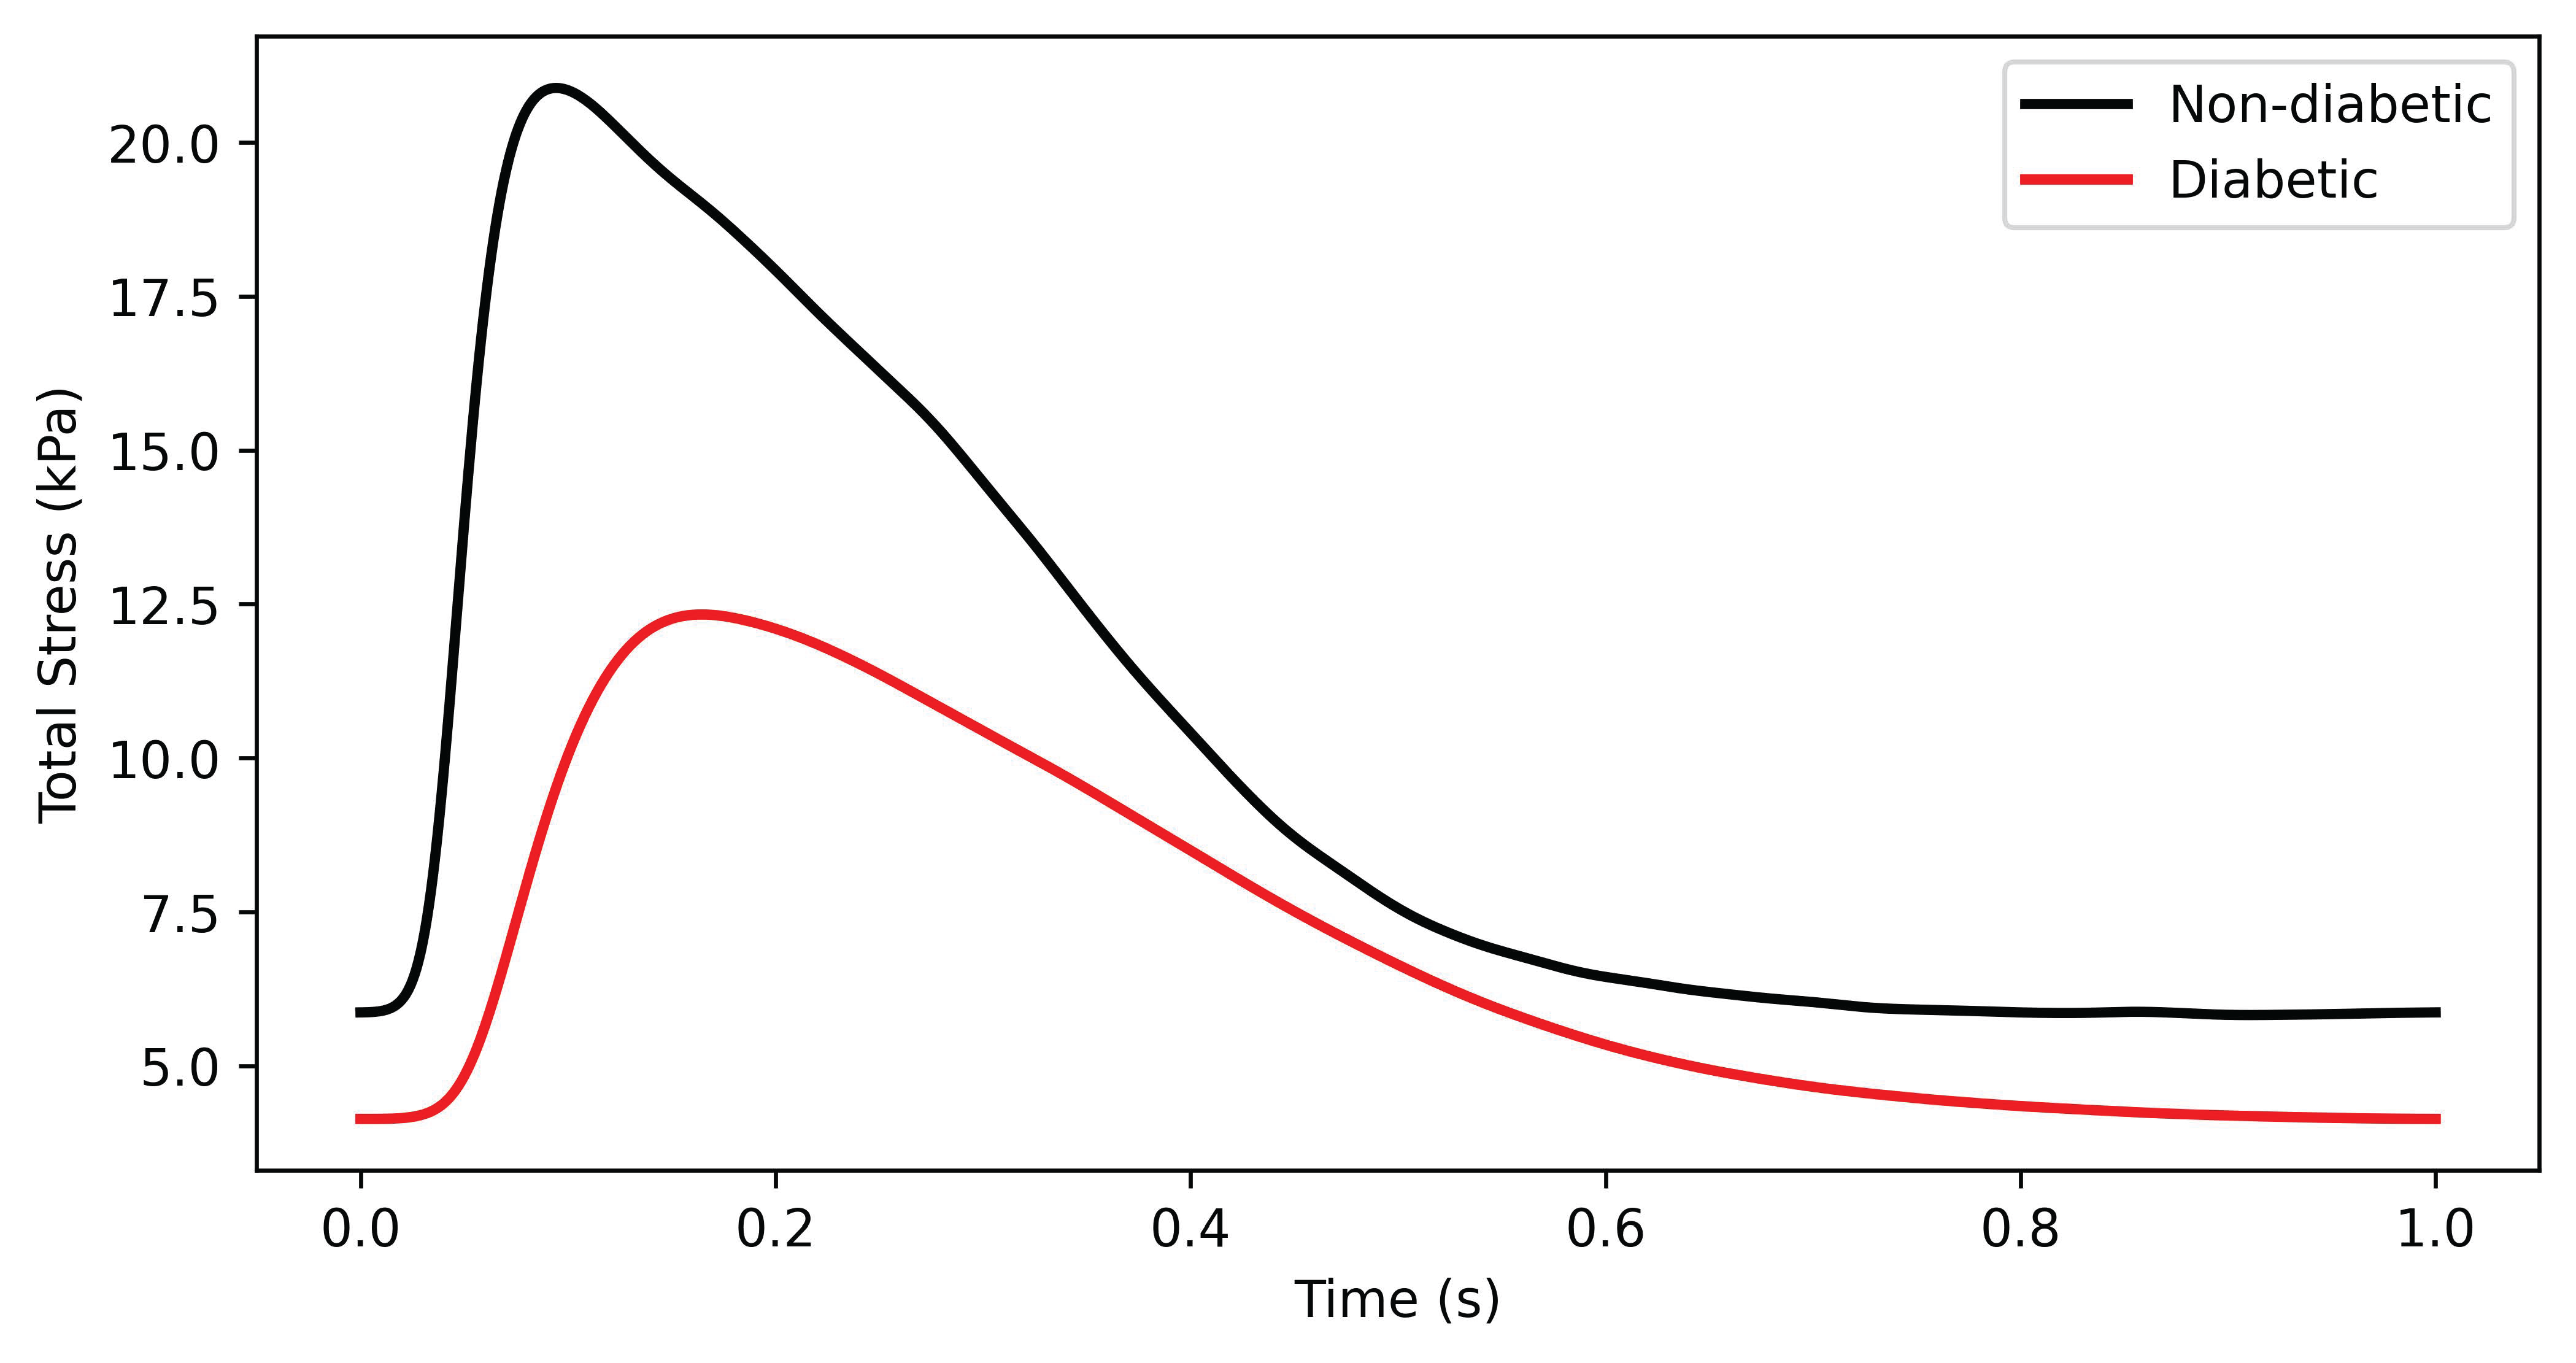
Figure 7:Reproduction of the simulation in Figure 5A of Musgrave et al. (2025), using the CellML code and Jupyter Notebook. This demonstrates simulation of isometric contractions in both models.
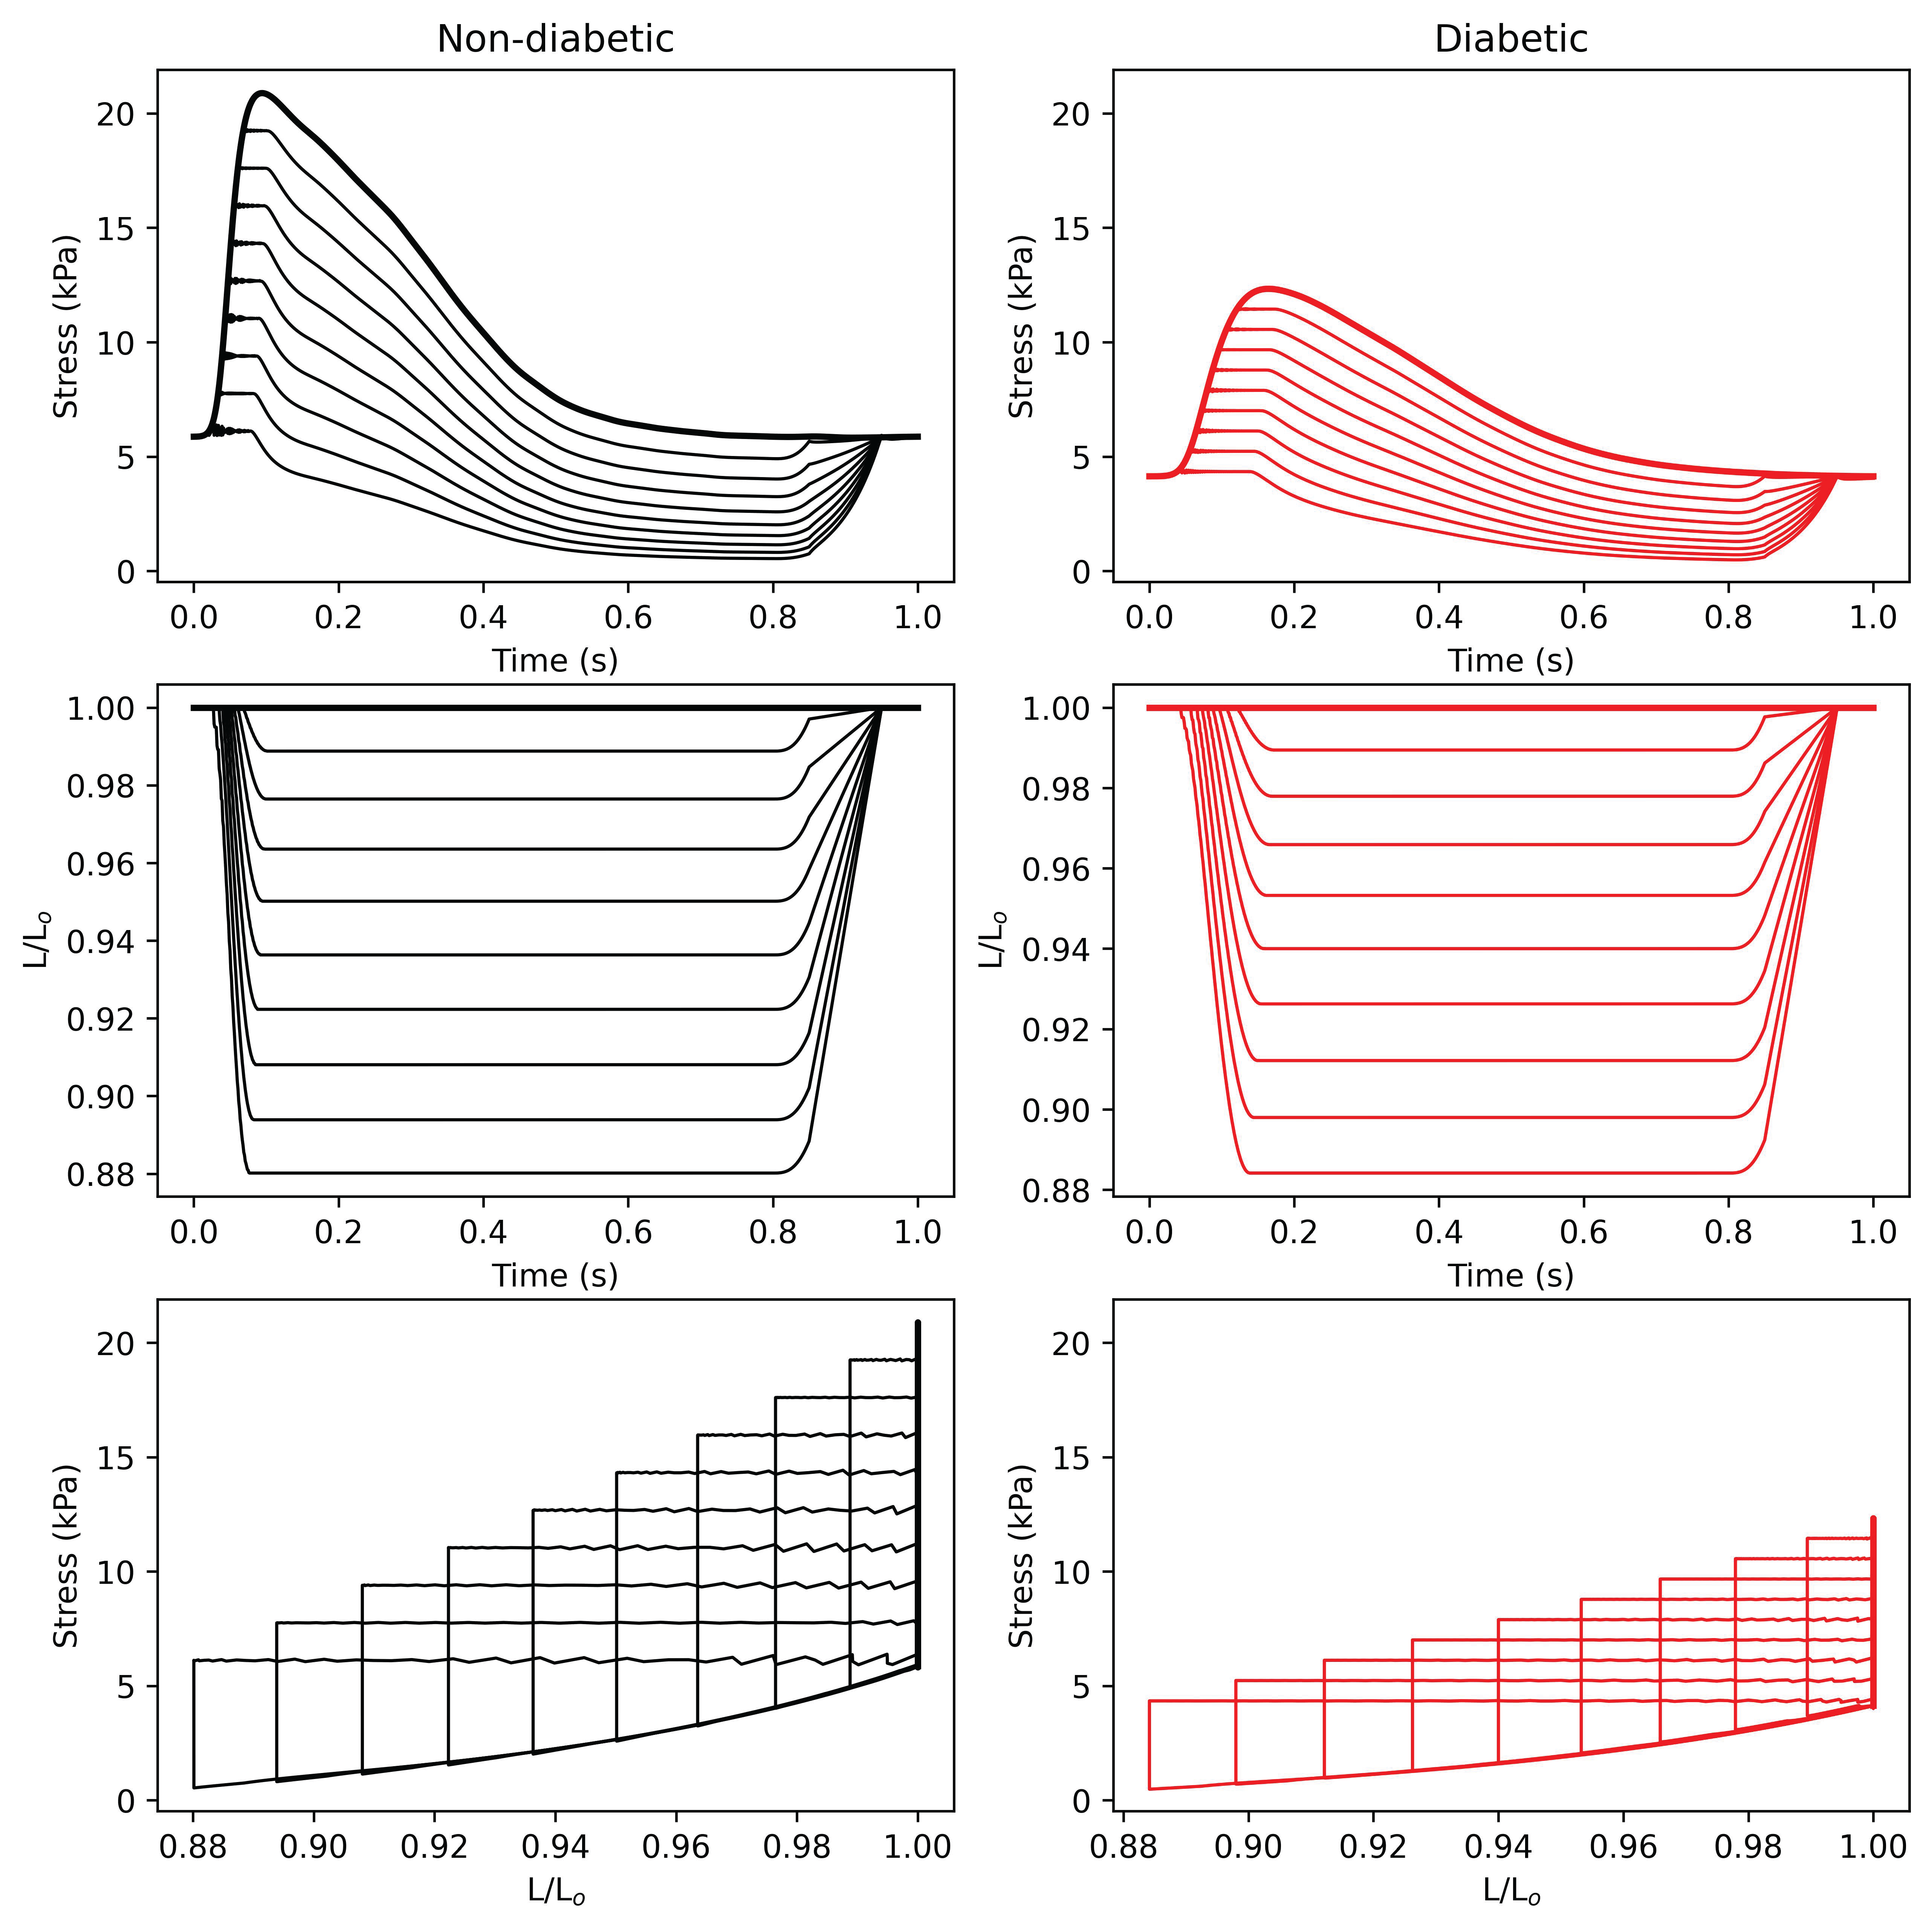
Figure 8:Reproduction of the simulation in Figure 6 of Musgrave et al. (2025), using the CellML code and Jupyter Notebook. This demonstrates simulation of work-loop contractions in both models, which are performed across a range of suitable afterloads.
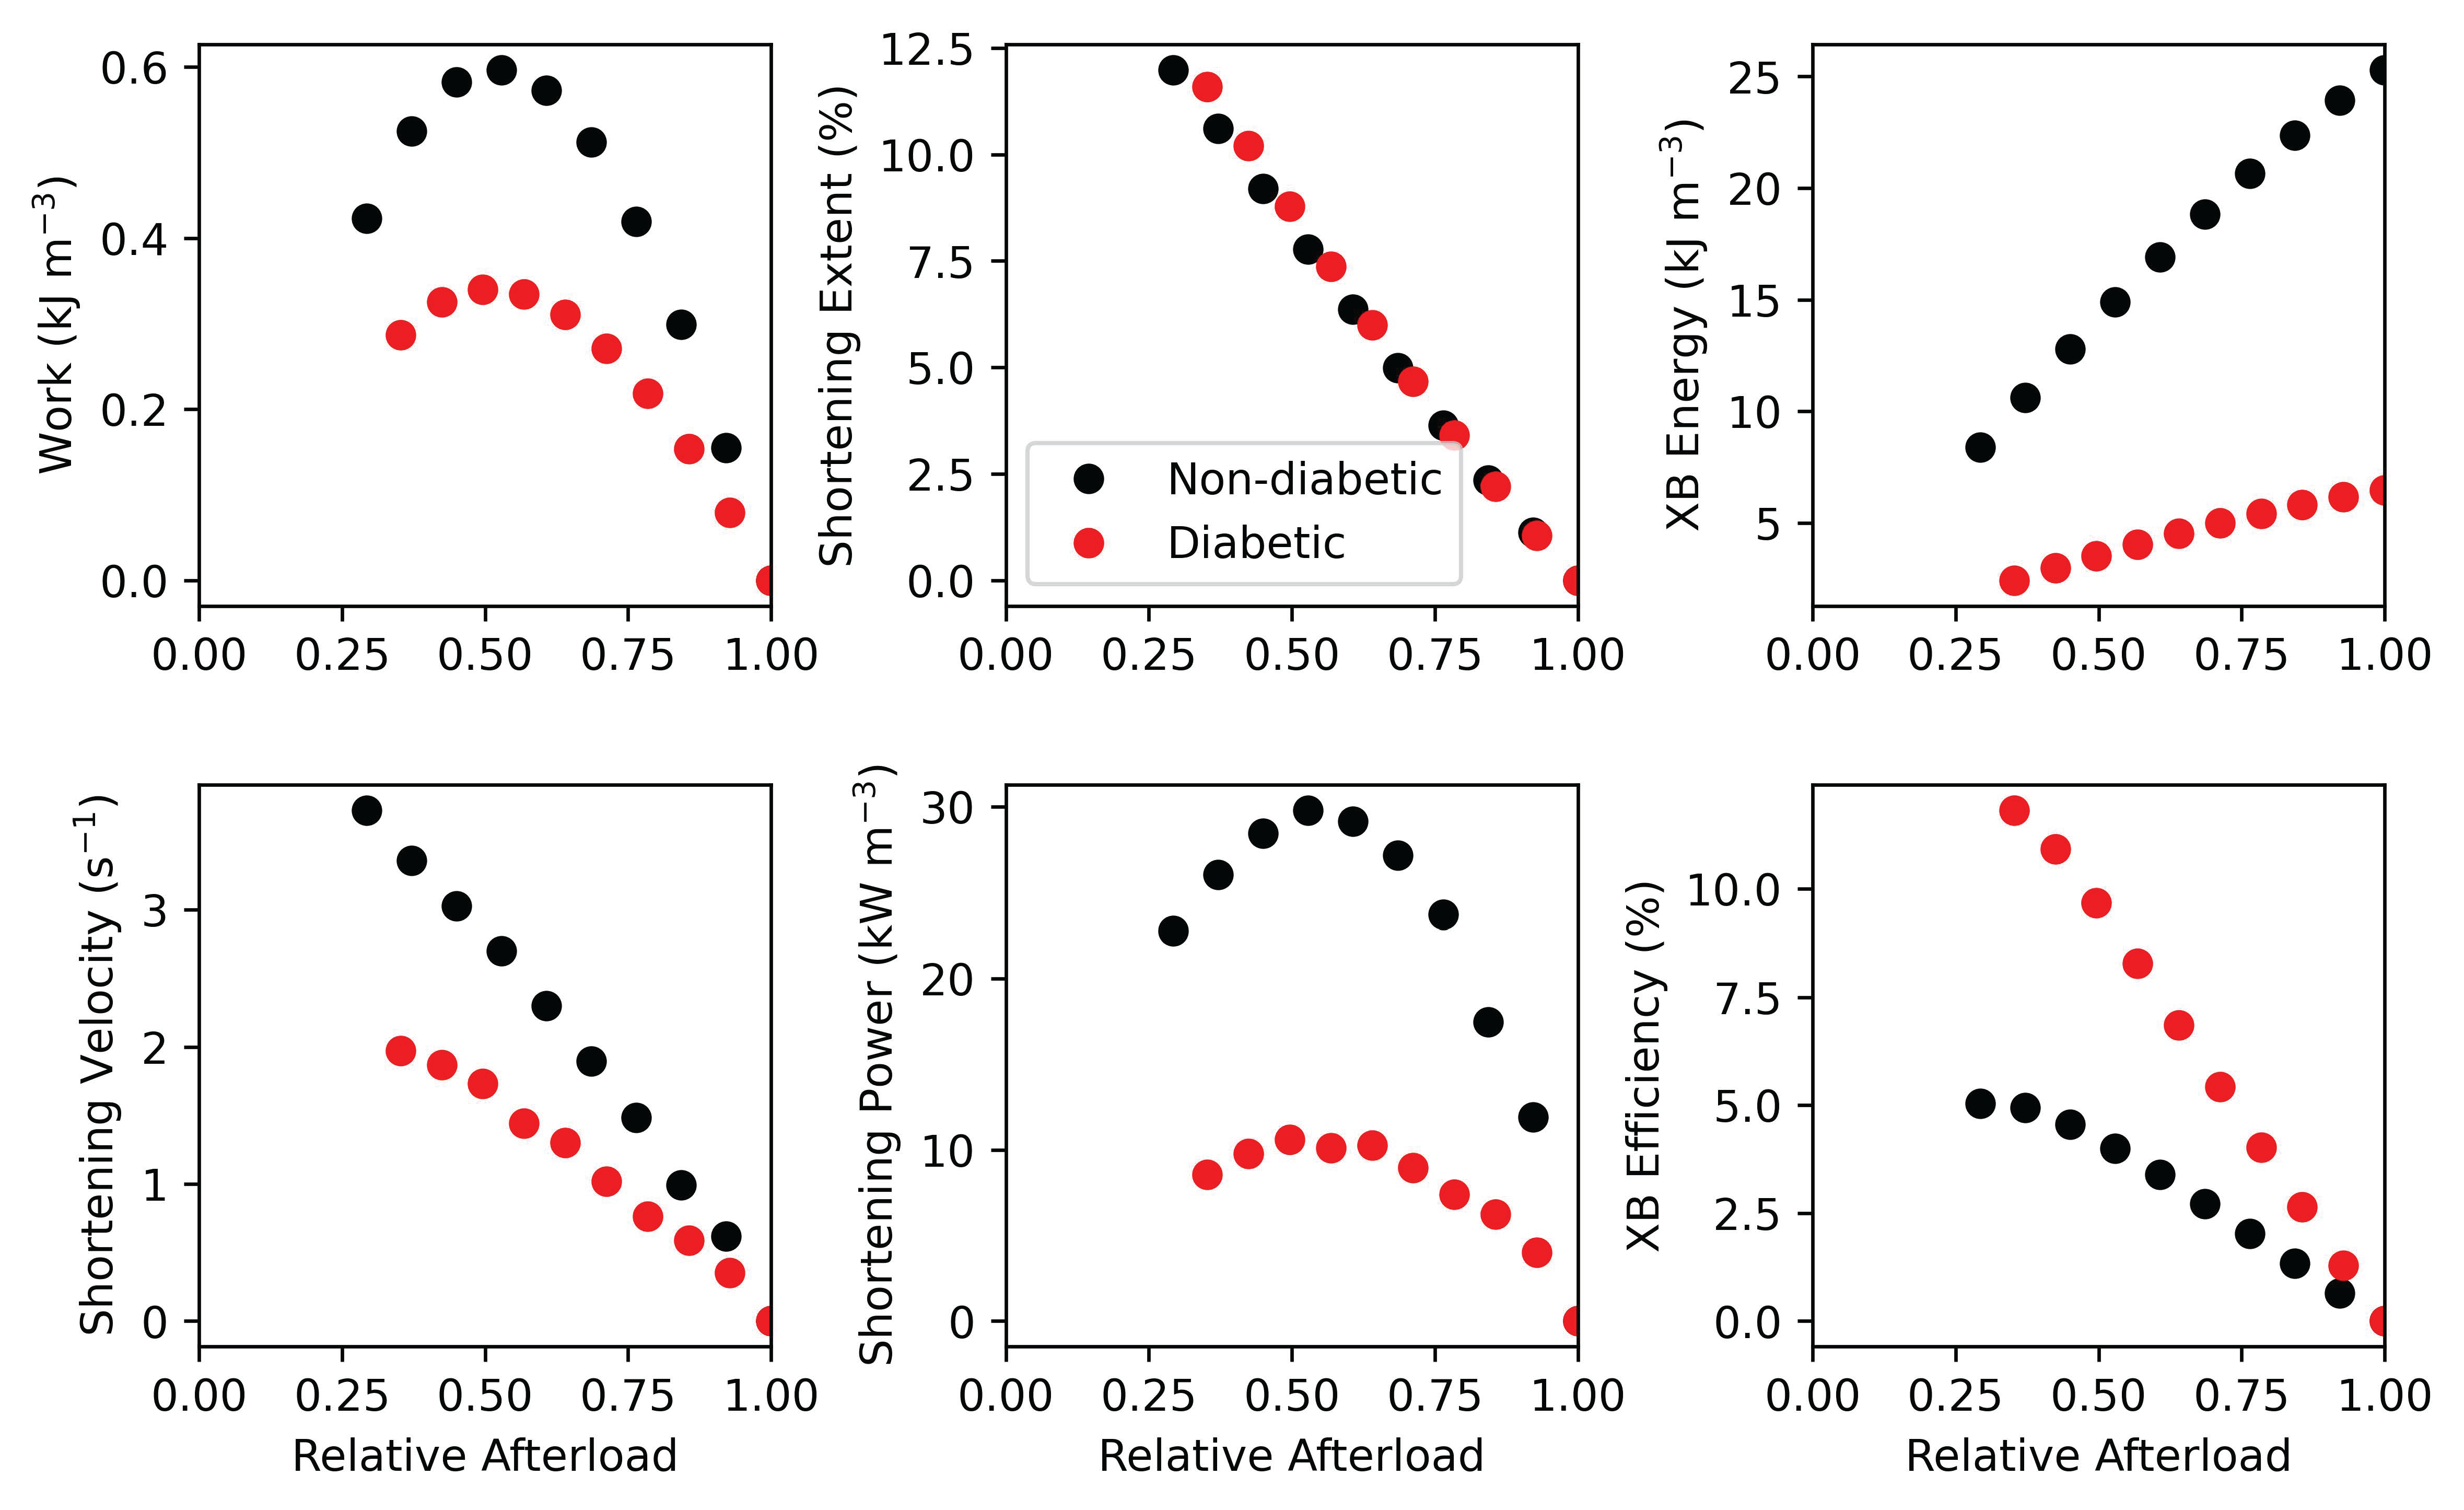
Figure 9:Reproduction of the simulation in Figure 7 of Musgrave et al. (2025), using the CellML code and Jupyter Notebook. This demonstrates the output metrics calculated from the range of work-loop simulations performed in Figure 8.
7Discussion
Following the process in Section 4, the MATLAB script reproduced the seven specified figures from the Primary Publication (Figures 3-6 and 10-12). The MATLAB script also reproduces Figures 2-4 of the Primary Publication, but these are not shown. A slight inconsistency was observed for the diabetic XB and diabetic Ca2+ simulation (orange points) for shortening velocity and shortening power in Figure 6. Compared to the Figure 10 in the Primary Publication, no outlier is observed at a relative afterload of 0.8. As shortening power (F) is calculated as a product of shortening velocity (E) and afterload, these are related measurements. The new simulations appear to have a smoother velocity-afterload relation, suggesting that the outlying point in Figure 10 of the Primary Publication was a numerical error in either the simulation or the calculation of maximum velocity. The result produced here is reproducible following repetition of the simulation. Aside from this minor difference, the seven figures are reproduced correctly and appear identical to those presented int the Primary Publication.
Due to the different software used for simulations and plotting, the CellML code produced figures that appeared slightly different to the three specified figures from the Primary Publication (Figures 7-9). However, there is sufficiently good agreement with the simulation outputs such that the model implementation can be considered consistent with the original version. Other than stylistic differences in the figures, the main difference between these two sets of simulations is in the isotonic phase of the work-loop contractions (flat top during the shortening phase in Figure 4 and Figure 8). The equations describing this phase were implemented identically in the MATLAB and CellML versions, but due to differences in the simulations themselves, these were not exactly equivalent. Specifically, the CellML model appears to have much more ringing and can not maintain a consistent stress level during this phase. This behaviour also occurs in the MATLAB model but to a much lesser degree. Manual adjustments of step size for the OpenCOR simulation were made, as well as matching the solver tolerances to those used in MATLAB and adjusting the parameters involved in isotonic control, but these changes did not result in a flatter isotonic phase. We therefore conclude that this is a consequence of either the different numerical solvers used (ode15s in MATLAB and CVODE in OpenCOR), or the restriction of not being able to combine the different phases of length control into a single model in CellML. Despite these visual differences, the outputs of the work-loop simulations (Figure 9) were consistent with those in the Primary Publication. This indicates that the simulations are fundamentally equivalent.
The models presented in Musgrave et al. (2025) were designed with the intention of potential future coupling with mitochondrial or electrophysiological models to further explore interactions of cellular systems in the diabetic heart. We have demonstrated that the associated repository contains reproducible model simulation code, which facilitates this future reuse.
8Appendix
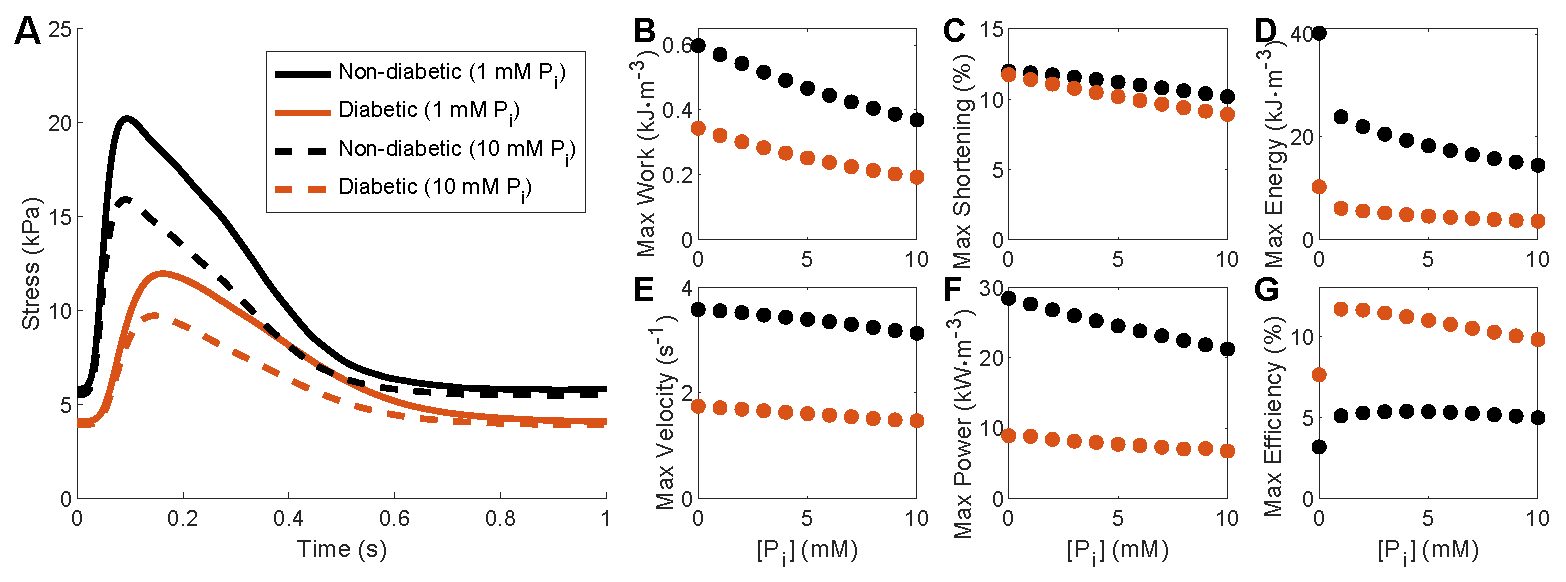
Figure 10:Reproduction of Figure 8 in Musgrave et al. (2025) using the MATLAB script. This demonstrates isometric and work-loop simulations under various Pi concentrations.
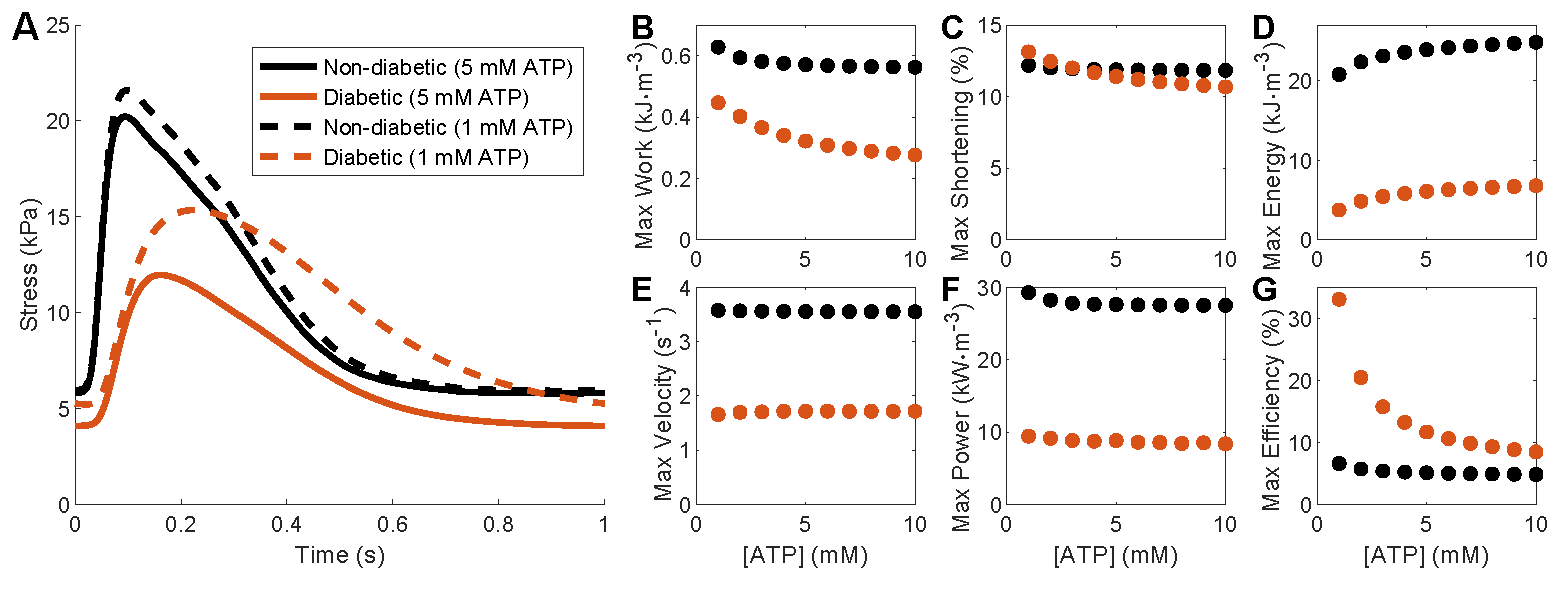
Figure 11:Reproduction of Figure 9 in Musgrave et al. (2025) using the MATLAB script.This demonstrates isometric and work-loop simulations under various ATP concentrations.
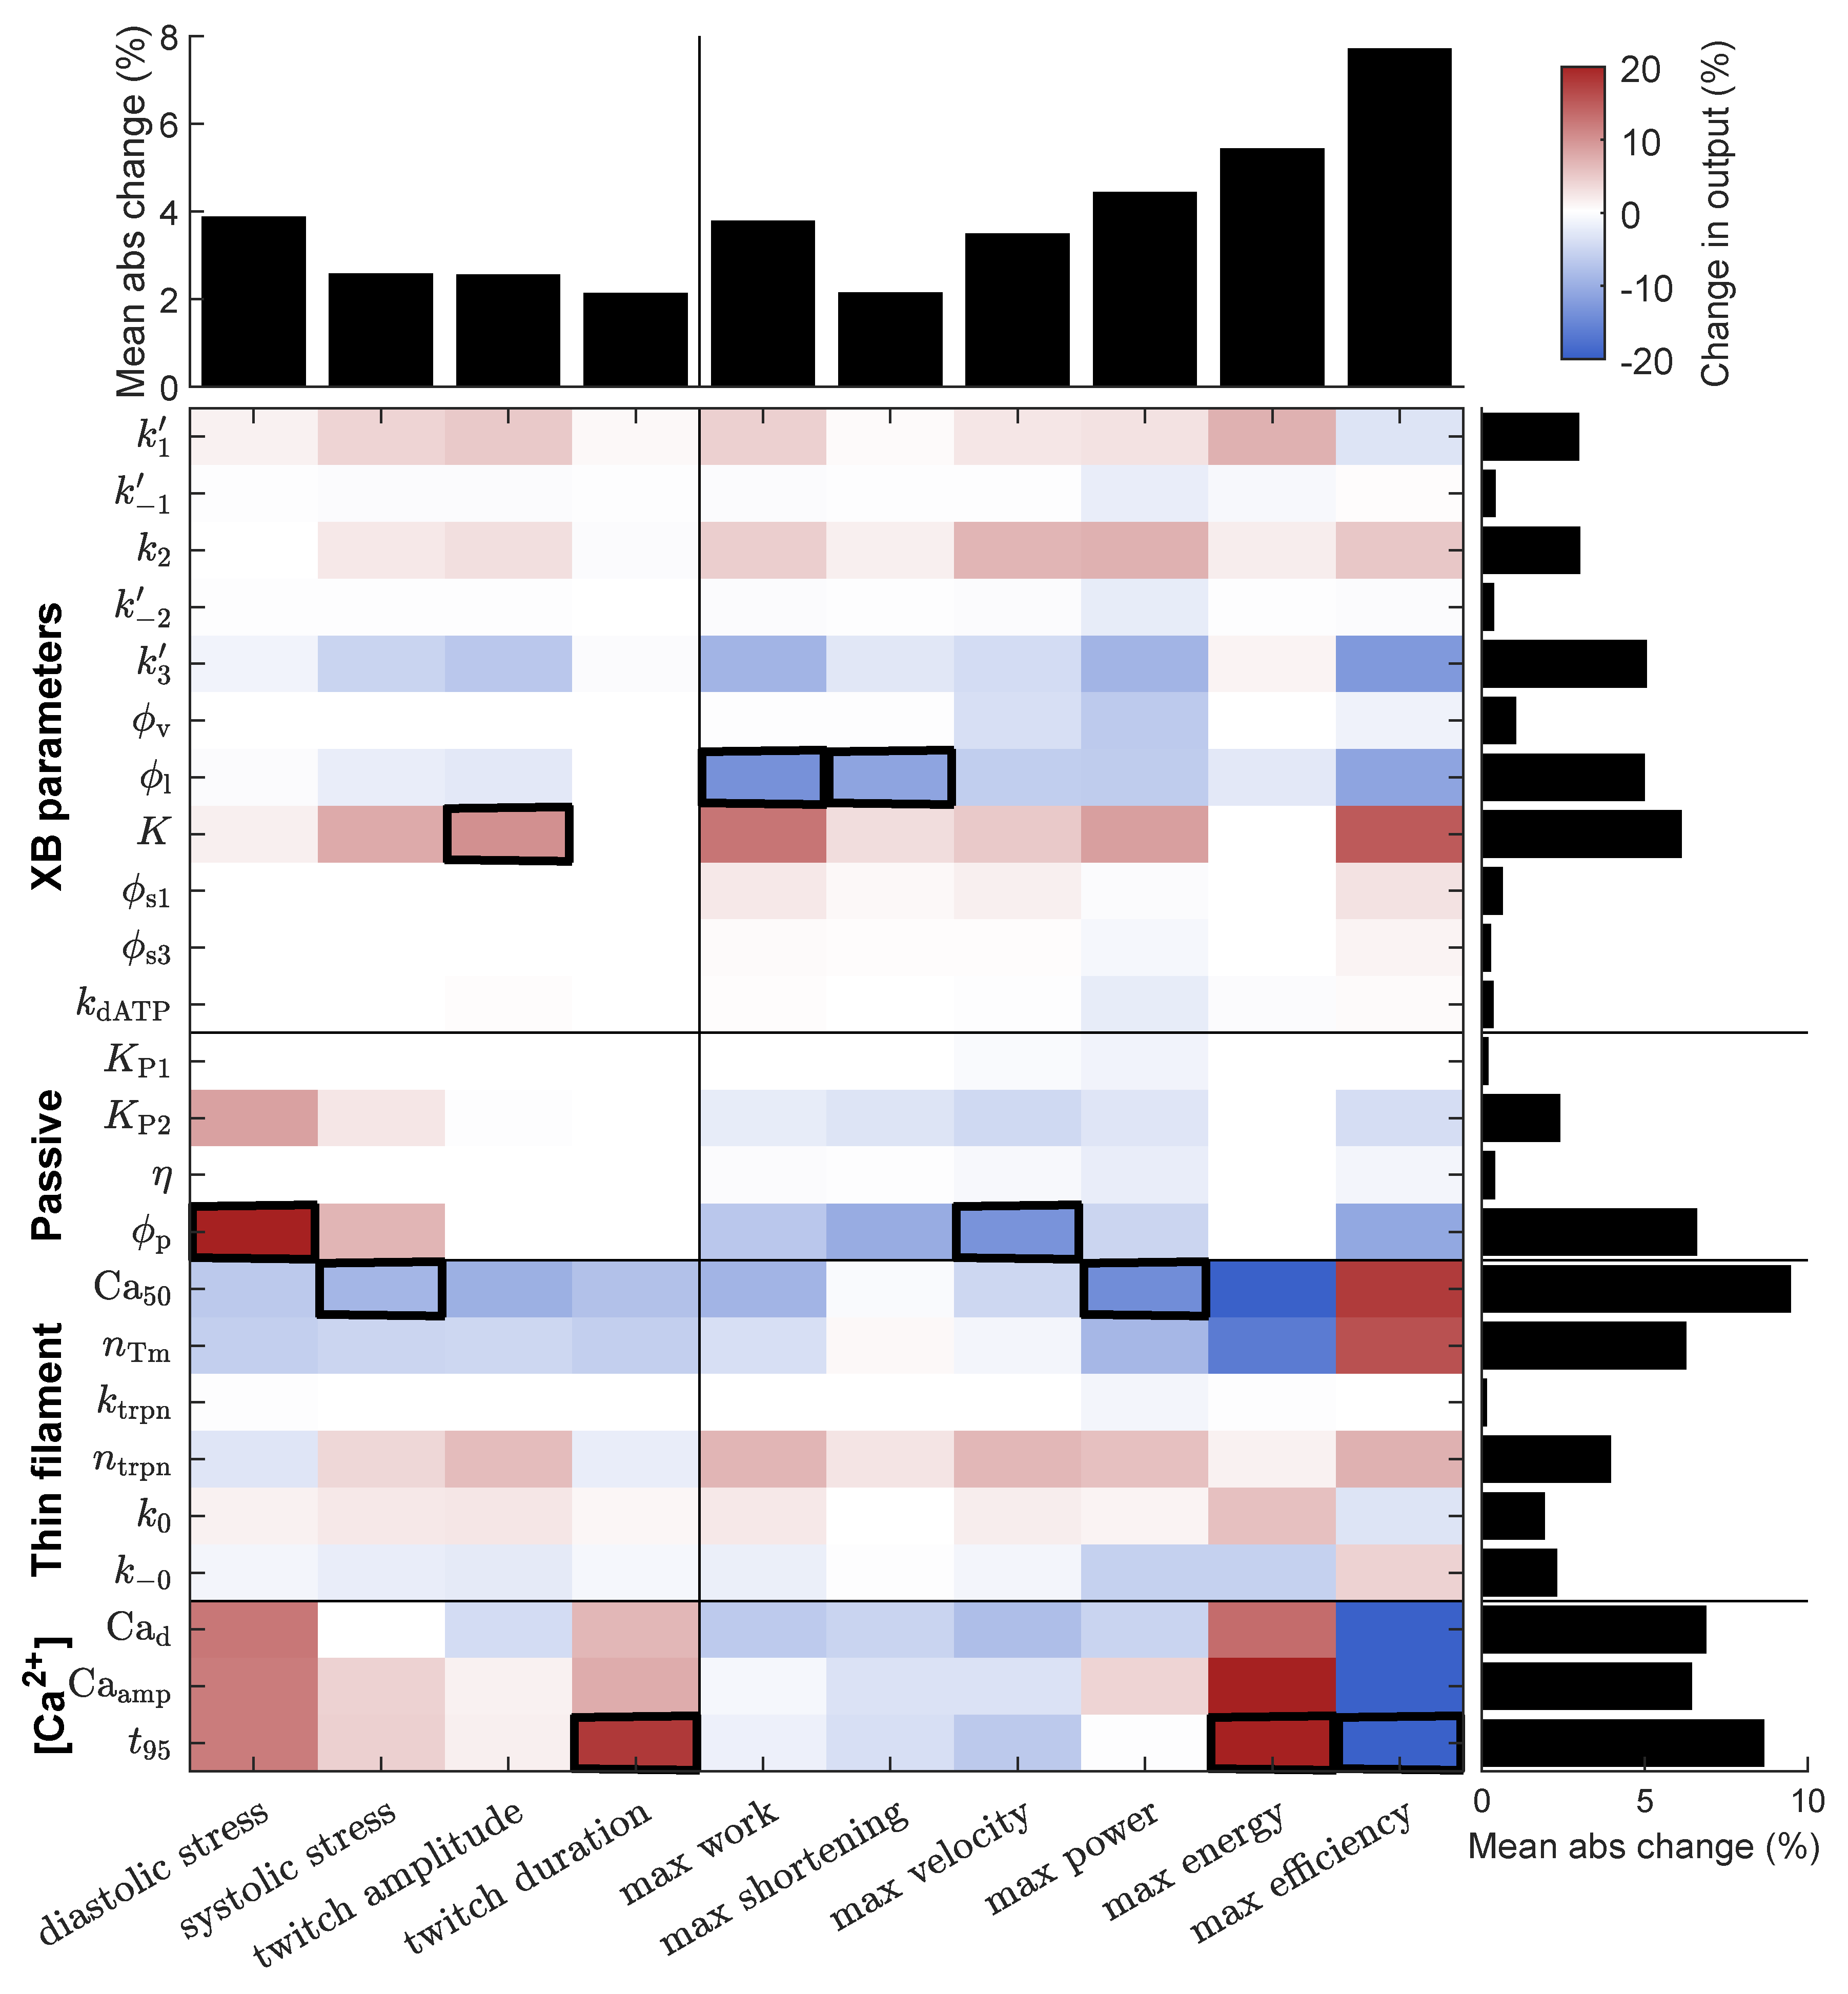
Figure 12:Reproduction of Figure 11 in Musgrave et al. (2025) using the MATLAB script. This is a sensitivity analysis demonstrating the effect of each parameter on the output metrics.
- Musgrave, J. H., Han, J.-C., Ward, M.-L., Taberner, A. J., & Tran, K. (2025). Metabolite-sensitive cross-bridge models of human atria reveal the impact of diabetes on muscle mechanoenergetics. Journal of Physiology. 10.1113/JP288463
- Musgrave, J. H., Han, J.-C., Ward, M.-L., Kang, N., Taberner, A. J., & Tran, K. (2025). Human cardiac tissues produce lower contractile stress and exhibit slower cross-bridge cycling in type 2 diabetes. Cardiovascular Diabetology, 24(266), 1–15. 10.1186/S12933-025-02820-7
- Razumova, M. V., Bukatina, A. E., & Campbell, K. B. (1999). Stiffness-distortion sarcomere model for muscle simulation. Journal of Applied Physiology, 87(5), 1861–1876. 10.1152/jappl.1999.87.5.1861
- Musgrave, J. H., Han, J.-C., Ward, M.-L., Taberner, A. J., & Tran, K. (2024). Analysis of metabolite and strain effects on cardiac cross-bridge dynamics using model linearisation techniques. Frontiers in Physiology, 14. 10.3389/fphys.2023.1323605
- Land, S., Park-Holohan, S. J., Smith, N. P., dos Remedios, C. G., Kentish, J. C., & Niederer, S. A. (2017). A model of cardiac contraction based on novel measurements of tension development in human cardiomyocytes. Journal of Molecular and Cellular Cardiology, 106, 68–83. 10.1016/j.yjmcc.2017.03.008
- Jones, T. L. M., Kaur, S., Kang, N., Ruygrok, P. N., & Ward, M.-L. (2023). Impaired calcium handling mechanisms in atrial trabeculae of diabetic patients. Physiological Reports, 11(3). 10.14814/phy2.15599
- Tewari, S. G., Bugenhagen, S. M., Palmer, B. M., & Beard, D. A. (2016). Dynamics of cross-bridge cycling, ATP hydrolysis, force generation, and deformation in cardiac muscle. Journal of Molecular and Cellular Cardiology, 96, 11–25. 10.1016/j.yjmcc.2015.02.006